


This data snapshot summarizes the most recent federal data on women and people of color holding nonmedical instructional faculty appointments in US higher education. The data source is the Integrated Postsecondary Education Data System (IPEDS) database.
Background
Fifty years ago, after Congress passed Title IX of the Education Amendments of 1972, barring gender-based discrimination in educational institutions that receive federal financial assistance, the AAUP issued On Discrimination, a brief statement declaring, “The Association is committed to use its procedures and to take measures, including censure, against colleges and universities practicing any sort of discrimination contrary to AAUP policy, including discrimination on the basis of age, sex, physical handicap, race, color, religion, national origin, or marital status.” Since then, representation of women and people of color has increased among faculty in US higher education, but gender-based, ethnic, racial, and other social inequities persist. To shine a light on these inequities, this data snapshot provides a demographic profile of faculty by academic rank and institution type, highlighting disparities in representation and access to tenure among women1 and underrepresented minorities2 as well as salary differences for full-time women faculty members.3
Figures in this data snapshot represent nonmedical instructional staff (instruction/research/public service or primarily instruction), with or without formal faculty status, in degree-granting nonprofit institutions participating in Title IV federal financial aid programs in the United States (fifty states and the District of Columbia) and are based on data from the IPEDS Human Resources survey, 2023–24 provisional release. General data on faculty appointments, including descriptions of faculty appointment types, are presented in a companion article, “Data Snapshot: Tenure and Contingency in US Higher Education, Fall 2023,” published in the spring 2025 issue of Academe. The gender, race, and ethnicity terminology used throughout this data snapshot is consistent with IPEDS survey definitions (see IPEDS race and ethnicity categories).
Summary of Findings
Representation of women and underrepresented minorities decreases with progression in rank (see figure 1).
- Just over one-third (37.2 percent) of full professors were women in fall 2023, while nearly half (46.0 percent) were white men.
- Women were overrepresented at lower ranks in fall 2023, making up 54.5 percent of assistant professors, 58.6 percent of instructors, and 56.1 percent of lecturers.
- Underrepresented minorities constituted 9.1 percent of full professors in fall 2023, including 4.5 percent who were Hispanic or Latino and 4.2 percent who were Black or African American.
Representation of women and underrepresented minorities decreases with progression in Carnegie Basic Classification (see figure 2).
- Among Research I universities, women constituted 44.7 percent of full-time faculty, and underrepresented minorities constituted 10.2 percent, including 5.5 percent who were Hispanic or Latino and 4.2 percent who were Black or African American.
- Among associate’s colleges, women constituted 55.5 percent of full-time faculty, and underrepresented minorities constituted 17.5 percent.
Full-time women and underrepresented minority (URM) faculty are more likely to hold contingent appointments than full-time men and non-URM (white or Asian) faculty (see figure 3).
- The percentage of full-time women faculty on tenured or tenure-track appointments was 52.1 percent in fall 2023, compared with 62.2 percent of full-time men.
- The percentage of full-time URM faculty on tenured or tenure-track appointments was 55.9 percent in fall 2023, compared with 56.6 and 65.3 percent, respectively, of full-time white and Asian faculty.
Women and URM faculty are less likely to have full-time positions than men and non-URM (white or Asian) faculty (see figure 4).
- The percentage of women faculty on full-time appointments was 54.6 percent in fall 2023, compared with 60.7 percent of men.
- The percentage of URM faculty on full-time appointments was 50.1 percent in fall 2023, compared with 56.2 and 73.6 percent, respectively, of white and Asian faculty.
Average salaries for full-time women faculty members are lower than average salaries for men at all ranks and Carnegie Basic Classifications (see figure 5).
- Full-time women faculty members earned an average of 84.1 percent of what men earned for all ranks combined in fall 2023.
- The gender pay gap was greatest at the professor rank, where women earned $20,599 (14.1 percent) less than men, on average, and at Research I universities, where women earned $27,474 (19.5 percent) less than men, on average.
Conclusion
This data snapshot documents gender and racial disparities in terms of representation, access to tenure, and economic security. Women and underrepresented minority faculty members are not only underrepresented at higher academic ranks and in Carnegie Basic Classifications that generally pay higher salaries but also have less access to tenure—a key mechanism for protecting academic freedom. As stated in the preamble to the 1940 Statement of Principles on Academic Freedom and Tenure, “Freedom and economic security, hence, tenure, are indispensable to the success of an institution in fulfilling its obligations to its students and to society.”
In its 2023 statement On Eliminating Discrimination and Achieving Equality in Higher Education, the AAUP reasserted its “fundamental and enduring commitment to holding colleges and universities accountable for accomplishing their highest purpose: serving the public interest through teaching, research, and service, thereby enabling an increasingly inclusive democracy to fulfill its role in a complex and interrelated world.” Part of that commitment involves producing resources such as this data snapshot and the AAUP’s interactive data website (https://data.aaup.org) that document current disparities within the academic community. It is equally necessary that our colleagues within higher education push institutions to change their policies and take an active role in the implementation and oversight of efforts to reduce gender-based, ethnic, racial, and other social discrimination in US higher education. Through such collaboration and well-informed collective actions, achieving shared goals becomes possible.
Glenn Colby is senior researcher at the AAUP.
Ruben Guzman is research assistant at the AAUP.
Figure 1. Representation of women and underrepresented minorities decreases with progression in rank.
Percentage of the total number of full-time faculty members by gender, race and ethnicity, and academic rank, fall 2023
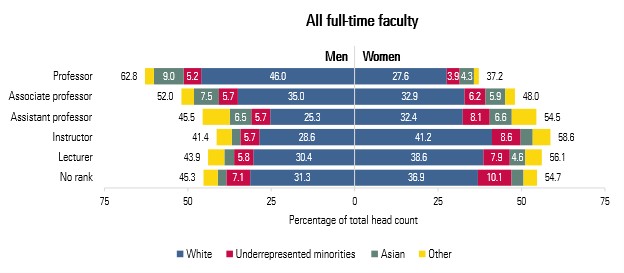
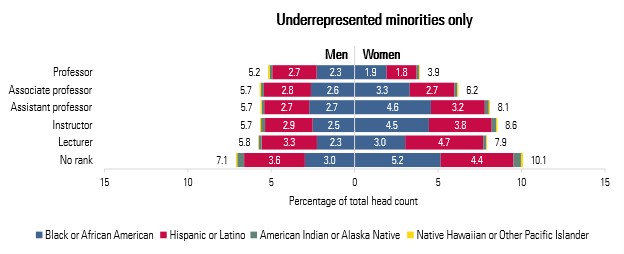
Note: “Other” includes the IPEDS race and ethnicity categories of two or more races, race and ethnicity unknown, and US nonresident.
Source: IPEDS Human Resources survey component 2023–24 provisional release. Data retrieved and compiled by the AAUP Department of Research and Public Policy on January 27, 2025.
Figure 2. Representation of women and underrepresented minorities decreases with progression in Carnegie Basic Classification.
Percentage of the total number of full-time faculty members by gender, race and ethnicity, and Carnegie Basic Classification, fall 2023
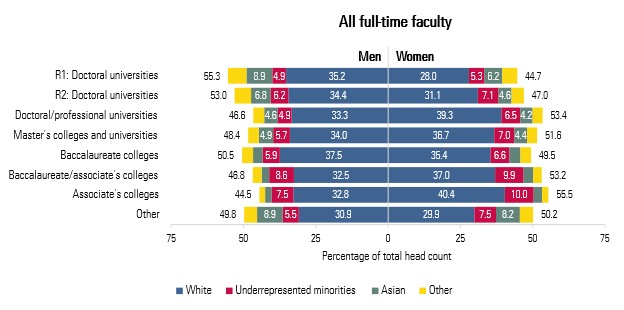
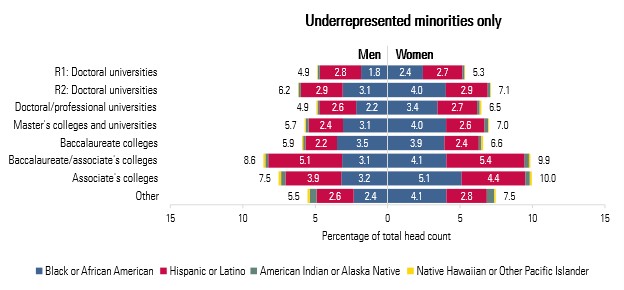
Note: “Other” includes the IPEDS race and ethnicity categories of two or more races, race and ethnicity unknown, and US nonresident. Definitions and methodology for the Carnegie Basic Classification system are available at https://carnegieclassifications.acenet.edu/carnegie-classification/. The category “other” for Carnegie Basic Classification includes special focus, tribal colleges, and not classified institutions.
Source: IPEDS Human Resources survey component 2023–24 provisional release. Data retrieved and compiled by the AAUP Department of Research and Public Policy on January 27, 2025.
Figure 3. Full-time women and underrepresented minority (URM) faculty are more likely to hold contingent appointments than full-time men and non-URM (white or Asian) faculty.
Percentage of the total number of full-time faculty members by appointment type, gender, and race and ethnicity, fall 2023
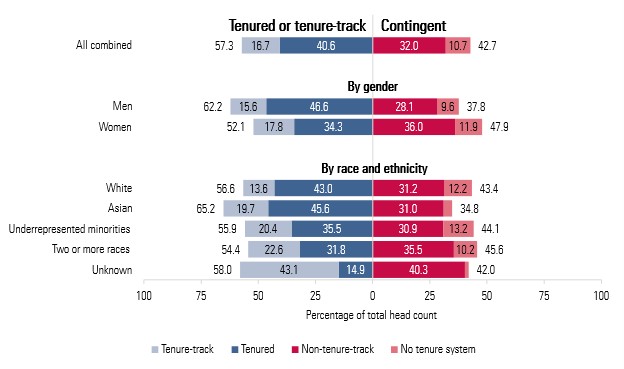
Note: “Unknown” includes the IPEDS race and ethnicity categories of race and ethnicity unknown and US nonresident. Percentages may not sum to totals because of rounding. The term contingent refers to appointments that are ineligible for tenure, including non-tenure-track appointments and appointments at institutions without tenure systems.
Source: IPEDS Human Resources survey component 2023–24 provisional release. Data retrieved and compiled by the AAUP Department of Research and Public Policy on January 27, 2025.
Figure 4. Women and underrepresented minority (URM) faculty are less likely to have full-time positions than men and non-URM (white or Asian) faculty.
Percentage of the total number of faculty members by employment status, gender, and race and ethnicity, fall 2023
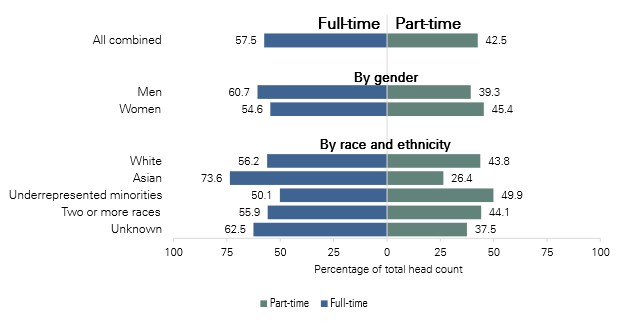
Note: “Unknown” includes the IPEDS race and ethnicity categories of race and ethnicity unknown and US nonresident.
Source: IPEDS Human Resources survey component 2023–24 provisional release. Data retrieved and compiled by the AAUP Department of Research and Public Policy on January 27, 2025.
Figure 5. Average salaries for full-time women faculty members are lower than average salaries for men at all ranks and Carnegie Basic Classification.
Average full-time faculty salaries, equated to nine-month contract, by gender, academic rank, and Carnegie Basic Classification, fall 2023
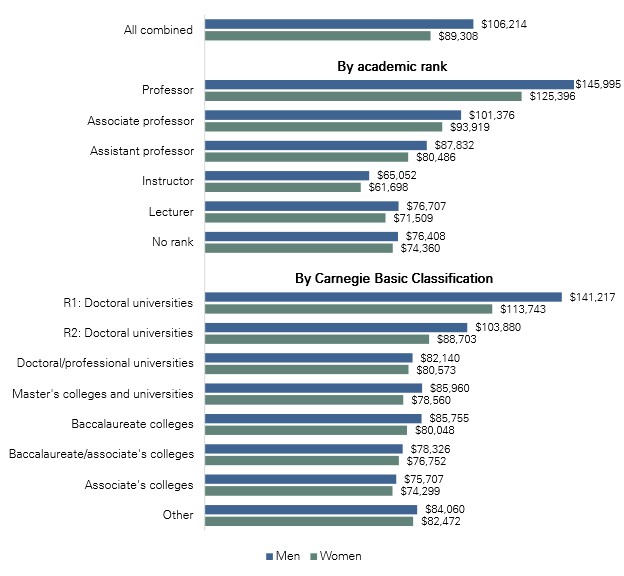
Note: Definitions and methodology for the Carnegie Basic Classification system are available at https://carnegieclassifications.acenet.edu/carnegie-classification/. The category “other” for Carnegie Basic Classification includes special focus, tribal colleges, and not classified institutions.
Source: IPEDS Human Resources survey component 2023–24 provisional release. Data retrieved and compiled by the AAUP Department of Research and Public Policy on January 27, 2025.
Notes
1. Reporting on nonbinary faculty members or faculty members whose gender is unknown is not possible because the IPEDS Human Resources survey assumes binary genders (men or women). Return to text.
2. The term underrepresented minority (URM) is used to facilitate direct comparison with prior reports and includes the IPEDS race and ethnicity categories of Black or African American, Hispanic or Latino, American Indian or Alaska Native, and Native Hawaiian or Other Pacific Islander. Return to text.
3. IPEDS does not collect full-time faculty salary data by race and ethnicity. Return to text.